The First Crack Is Not Where I Expected It
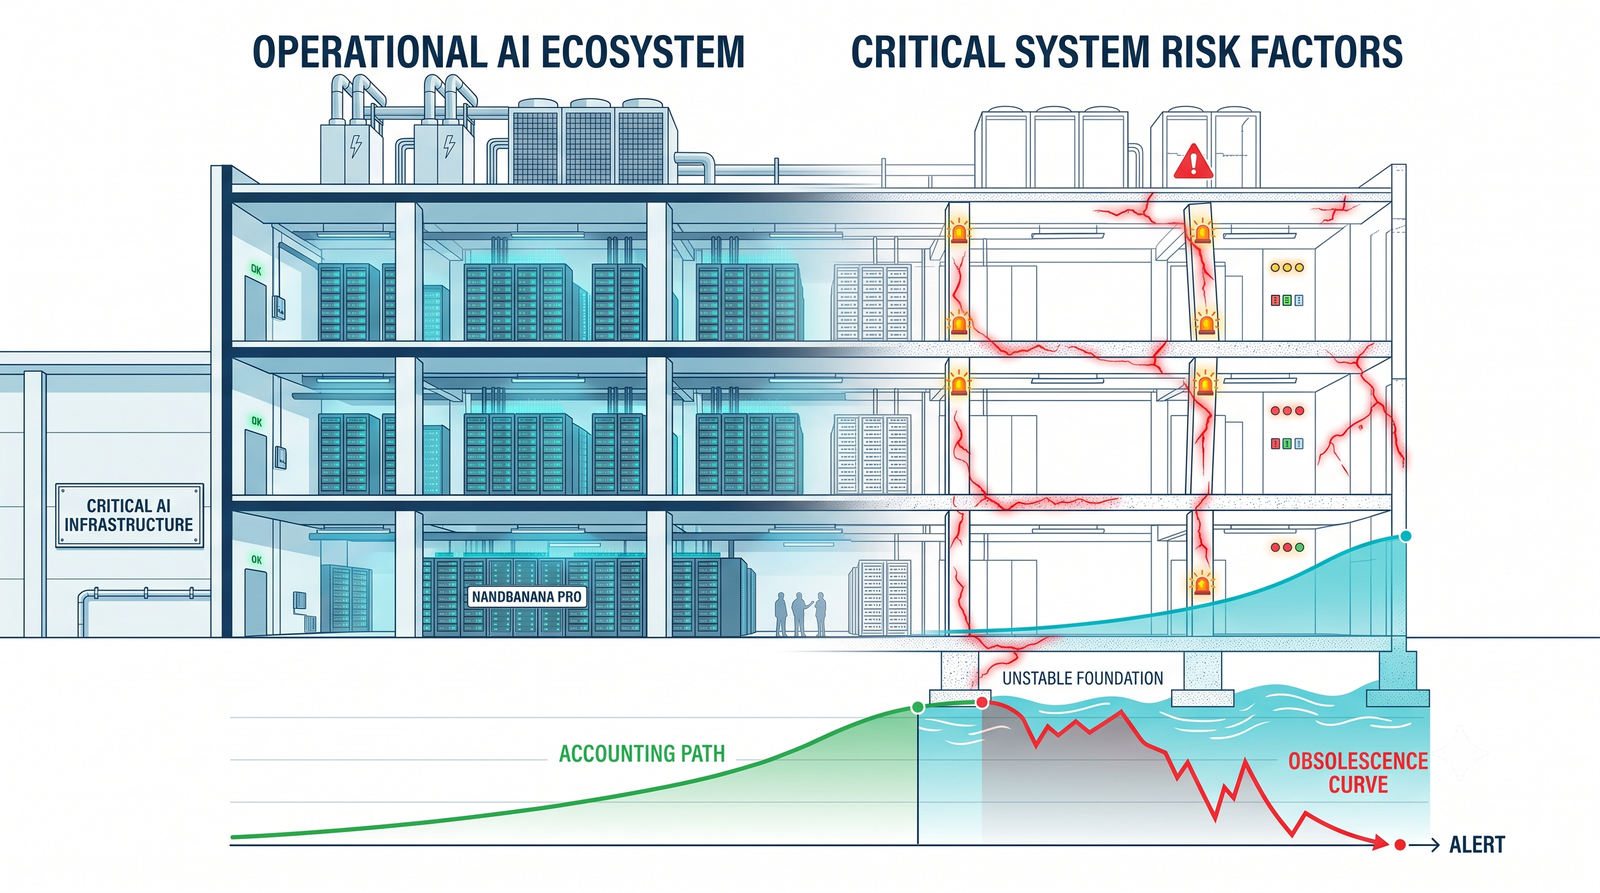
Q2 2026 update to the forensic monitor: Meta is spending more to sell less, Microsoft made $15 billion of capex disappear without spending a dollar less, and the Fed just made the whole thing a credit story.
→ Live Monitor: blackmantrading.com/ai-bubble-monitor
This is a follow-up to The AI Capital Supercycle Is Showing Cracks, published 19 July. The monitor has been updated with everything below.
When I published the monitor two weeks ago, I built it around a specific failure mode: the Dot-Com pattern, where revenue decelerates first and the accounting is exposed second. That was the wrong shape, and the Q2 prints told me so within a fortnight.
Four of the big five reported between 22 and 30 July. What came back was almost uniform, and almost the opposite of what the monitor was designed to catch: the financial leg deteriorated sharply at every one of them, while the demand leg accelerated. Alphabet went free-cash-flow negative for the first time as a public company. Amazon's trailing FCF swung from +$18.2B to −$7.6B and its CFO confirmed the build-out is now partly debt-funded. And yet AWS grew 36.7% — the fastest in eighteen quarters, its fifth straight acceleration — with operating margin expanding 650bps during peak capex. Azure printed 43%.
Accelerating, profitable, contracted revenue funded by negative free cash flow is not a bubble bursting. It is something stranger, and I said so in the update. Then Meta reported.
Meta Broke the Pattern
[SCREENSHOT PLACEHOLDER: Latest Hyperscaler Prints table — Q2 2026 capex, guidance revisions, tape reactions]
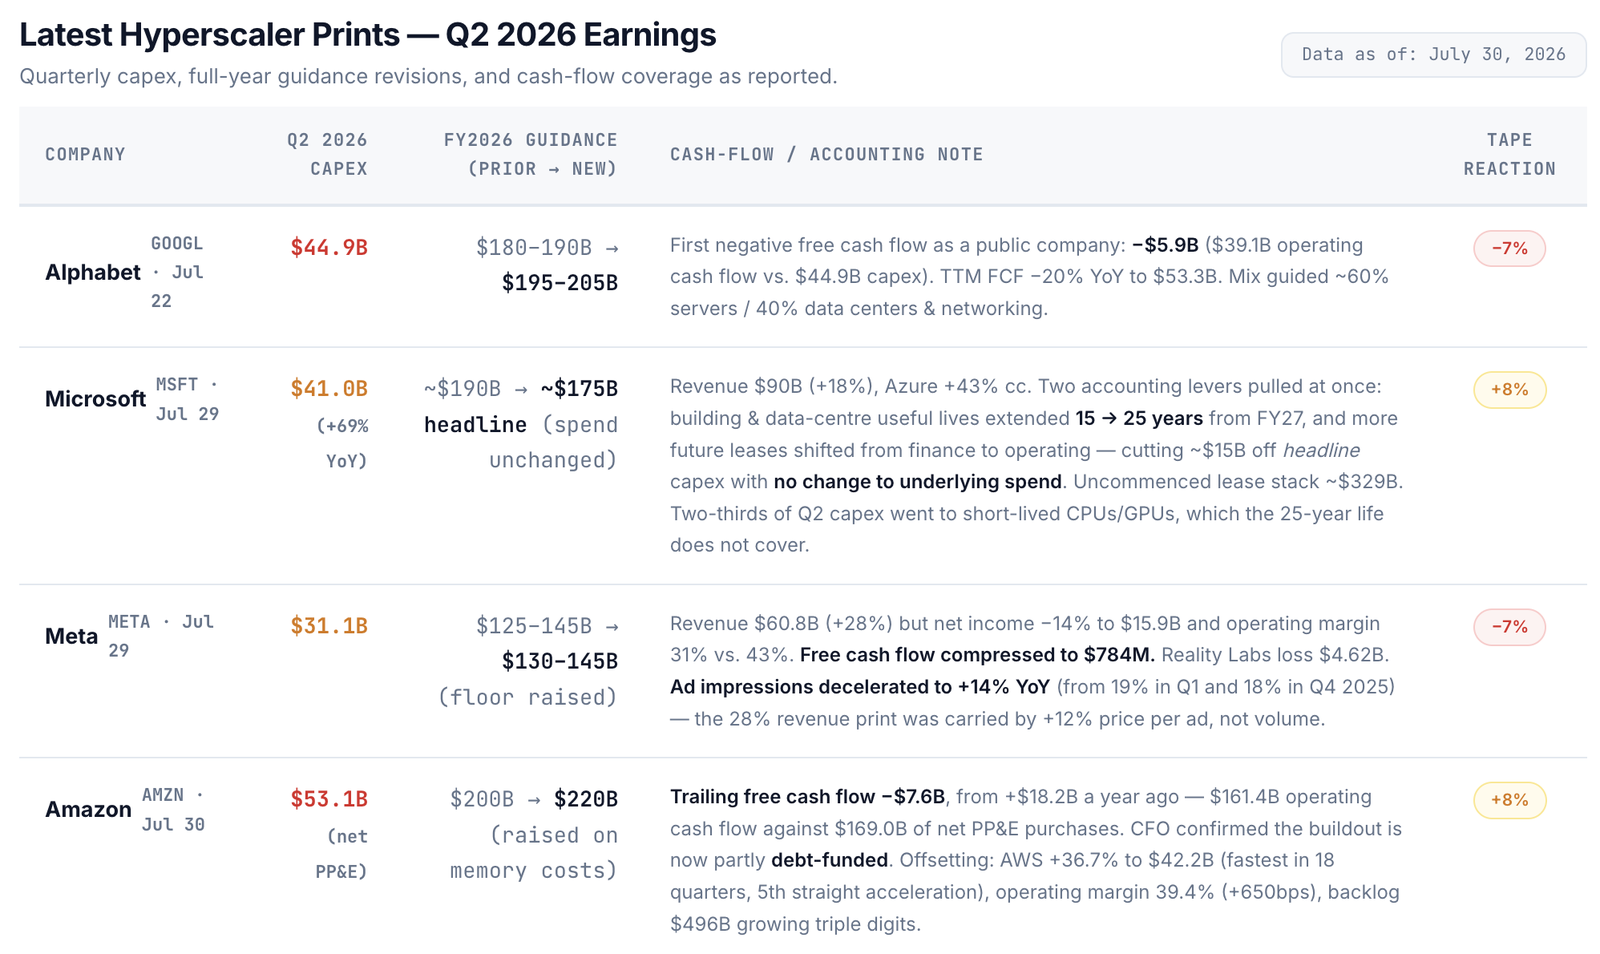
Here is the number nobody led with. Meta's ad impressions — the volume measure underneath the advertising engine that pays for all of this — grew 14% year-on-year in Q2. In Q1 it was 19%. In Q4 2025 it was 18%.
Revenue still printed +28% to $60.8B, which is why the headline looked fine. But that 28% was carried by a 12% rise in price per ad, not by units. Meta sold modestly less and charged materially more for it.
Against that, in the same quarter:
- Capital expenditure nearly doubled year-on-year, to $31.1B
- Full-year guidance floor was raised to $130–$145B
- Free cash flow collapsed to $784 million
- EPS came in at $6.18 against ~$7.2 expected, a 14% miss that snapped six straight beats
- The stock took roughly −7%
That is spending more to sell less, in one quarter, at one company — and it is the first genuine demand-side crack in the cohort. It does not overturn the read on the other three. Azure at 43% and AWS at 36.7% are not decelerating by any definition. But it matters where it appeared.
Amazon and Microsoft sell capacity against contracted backlogs — $496B and $678B respectively, with multi-year weighted lives. Meta is spending against an advertising market it has to re-win every single quarter. It has the least contracted revenue to fall back on and the thinnest cushion if volume keeps sliding, and it is layering that on top of $27B of construction-in-progress and a 5.5-year server-life extension already deferring $2.9B of depreciation a year.
The crack showed up at the name with the least to absorb it. That is not a coincidence, and it is now its own row on the monitor.
Microsoft Made $15 Billion Disappear
[SCREENSHOT PLACEHOLDER: Microsoft row of the prints table, showing ~$190B → ~$175B headline with spend unchanged]

Microsoft's quarter was received as the reassuring one. Revenue $90B, Azure +43%, capex guidance held, stock +8%. Read the accounting and it is the single best illustration of the thesis this monitor exists to track.
Two levers were pulled at once.
Lever one: effective at the start of FY27, Microsoft extends the estimated useful life of its data centres and office buildings from 15 years to 25 years. The CFO's framing — that it reflects "our operating history and expected use of these assets" and "affects only the timing of future depreciation" — is accurate and entirely beside the point. Lower annual depreciation means higher reported earnings, and the effect is already baked into forward guidance. Earnings are being supported by an estimate revision.
Note carefully what this does not cover. Roughly two-thirds of the quarter's capex went to CPUs and GPUs — short-lived assets on fast replacement cycles. The 25-year life applies to the shells. Microsoft lengthened the depreciation tail on the least depreciation-sensitive part of the asset base, which is exactly the part that was never the risk.
Lever two, and this is the one that got past almost everyone: the headline calendar-2026 capex number falls from roughly $190B to roughly $175B — with no reduction in spending plans at all. The gap is a classification change. More future data-centre leases move from finance leases (which count in reported capex) to operating leases (which do not). Fifteen billion dollars of real, committed spending simply leaves the headline. The uncommenced lease stack behind it sits around $329B.
So the "capex discipline" that drove an 8% rally was, in substantial part, a decision about which column obligations sit in.
This forces a correction to something in my original piece. I wrote that Microsoft was the only hyperscaler still free-cash-flow positive, at +$19.6B, and treated that as evidence of superior operating strength. That status now looks partly like a function of where lease obligations are classified and how long building lives are assumed to run. I have flagged it on the monitor rather than quietly editing it, because the correction is more interesting than the original claim.
The Part That Turns Accounting Into Credit
[SCREENSHOT PLACEHOLDER: Early Warning Matrix — new Long-End Financing Cost row, elevated]
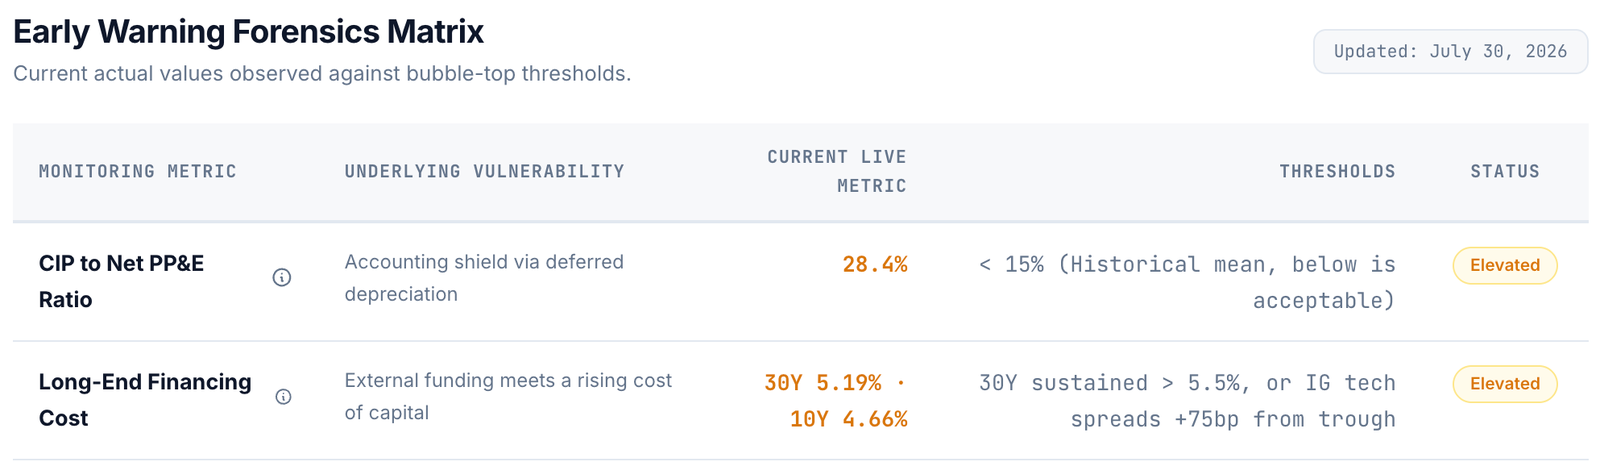
On 29 July, the same day Microsoft and Meta reported, the FOMC held at 3.50–3.75% on a 9–3 vote. Hammack, Kashkari and Logan all dissented in favour of a hike — the first time since September 2016 that three policymakers dissented in the same direction.
The market took the point. The 10-year closed at 4.657%. The 30-year pushed past 5.19%, its highest level since 2007.
I did not have a rates indicator on the monitor. That was an omission, and here is why it mattered more this quarter than last:
Everything in the original piece — CIP deferrals, useful-life extensions, circular vendor financing — describes an accounting fragility. Accounting fragility is survivable as long as the build-out is funded from internal cash generation, because nobody has to be persuaded to keep lending. That condition just broke. Alphabet and Meta are burning through their own cash generation. Amazon's CFO confirmed debt issuance on the call.
Rising long rates lift the hurdle on every incremental dollar of capex at precisely the moment incremental returns are compressing — Microsoft's cumulative incremental ROIC has roughly halved, from 51.2% in the pre-AI era (FY2019–FY2022) to 24.5% across the AI capex era (FY2022–FY2026). For the leveraged neo-clouds already borrowing above 10%, it compresses debt-service coverage directly. CoreWeave's 2025 debt service alone consumed nearly its entire annual revenue.
An accounting story becomes a credit story at the exact point where the marginal dollar has to be borrowed. The cohort crossed that line this quarter, into a rising long end, with three Fed officials openly pushing for higher.
The Matrix, Updated
[SCREENSHOT PLACEHOLDER: Full Early Warning Forensics Matrix with the two new rows]
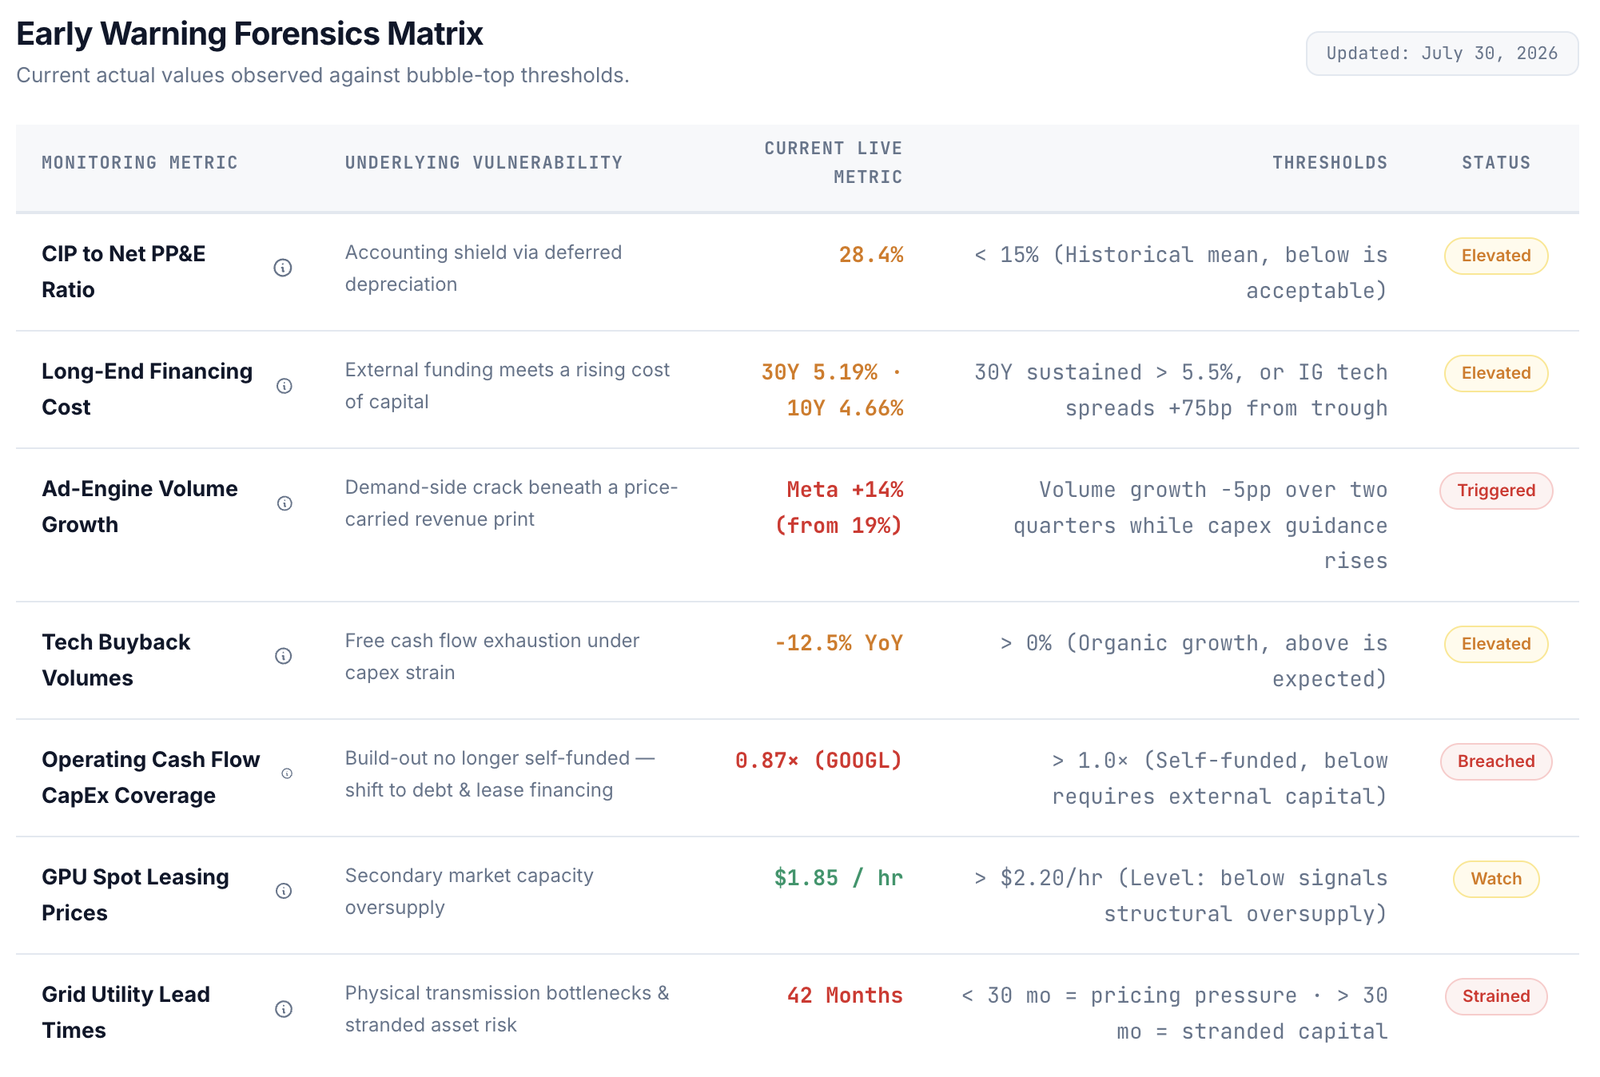
Two new indicators are now live on the monitor:
| Indicator | Current | Threshold | Status |
|---|---|---|---|
| CIP to Net PP&E Ratio | 28.4% | < 15% historical mean | Elevated |
| Long-End Financing Cost | 30Y 5.19% · 10Y 4.66% | 30Y sustained > 5.5% | Elevated |
| Ad-Engine Volume Growth | Meta +14% (from 19%) | −5pp over two quarters while capex rises | Triggered |
| Operating Cash Flow / CapEx Coverage | 0.87× (GOOGL) | > 1.0× self-funded | Breached |
| Tech Buyback Volumes | −12.5% YoY | > 0% organic growth | Elevated |
| GPU Spot Leasing | $1.85/hr | > $2.20/hr | Watch |
| Grid Utility Lead Times | 42 months | 30 months either way | Strained |
Two rows now sit past their threshold rather than approaching it: cash-flow coverage, which Alphabet breached at 0.87× by definitionally requiring external funding, and ad-engine volume, which is the first demand-side indicator on this monitor to trigger on reported data rather than sit in watch. Every other red flag on the page to date has been an accounting or financing measure. This one is customers.
→ Explore the full matrix with interactive tooltips
What I'm Watching Now
The original four still stand. These three are new, and they are ranked by what would change my mind fastest:
- Does Meta's impression growth stabilise in Q3, or keep sliding? One quarter is noise; two is a trend, and a second consecutive step down while capex guidance holds at $130–145B is the cleanest bear signal available in this cycle. Alphabet's volume disclosures are the control group.
- Does anyone else reclassify? Microsoft has now demonstrated that headline capex can be reduced by roughly $15B through lease classification alone. If a second hyperscaler guides capex down and the reason turns out to be accounting rather than restraint, the market's read on "discipline" becomes unreliable across the whole cohort.
- Does the 30-year hold above 5.2%? Sustained above 5.5%, with investment-grade tech spreads widening from their trough, and the funding assumptions under a trillion dollars of announced 2027 capex stop working.
The tripwire I named in the original piece has not changed: CIP converting to depreciating PP&E without a matching revenue step. Nothing this quarter altered that. What changed is that there are now three additional ways to get there.
Final Thought
I built this monitor expecting the revenue side to crack first, because that is how 1999 went. Three of the four biggest spenders just told me revenue is accelerating, profitably, against contracted backlogs — and the fourth told me its volumes are rolling over while it doubles its spending.
Both of those are true simultaneously. That is the actual state of the cycle, and it is less satisfying than either the bull or the bear version.
The useful discipline is to keep the two ledgers separate: what the accounting is doing, and what the demand is doing. This quarter the accounting got materially more aggressive at Microsoft, the demand got materially weaker at Meta, and the financing got materially more expensive for everyone. None of those three is a crash. All three are the conditions under which one becomes possible.
The monitor is live, and I update it as each quarter's prints and filings land.
→ blackmantrading.com/ai-bubble-monitor
This is research and visualisation, not financial advice. All figures from company Q2 2026 earnings releases and calls, FOMC statements, and Treasury market data as of 3 August 2026.
Gemini Image Prompt
A clean, editorial-style illustration for a financial newsletter. A vast data center rendered as a precise architectural cross-section, but the structure is subtly out of balance — one supporting column is visibly thinner than the others and beginning to buckle, while the rest of the building remains pristine and brightly lit. Beneath the foundation, a rising tide line marked by a steep ascending curve presses upward against the base. Color palette: deep slate background, cyan and teal accent highlights, a single warning amber on the failing column. Clean minimal style, no text. Aspect ratio 16:9. Professional and restrained — think Bloomberg or Economist editorial illustration, quietly unsettling rather than dramatic.